Summary: Latitude vs. X
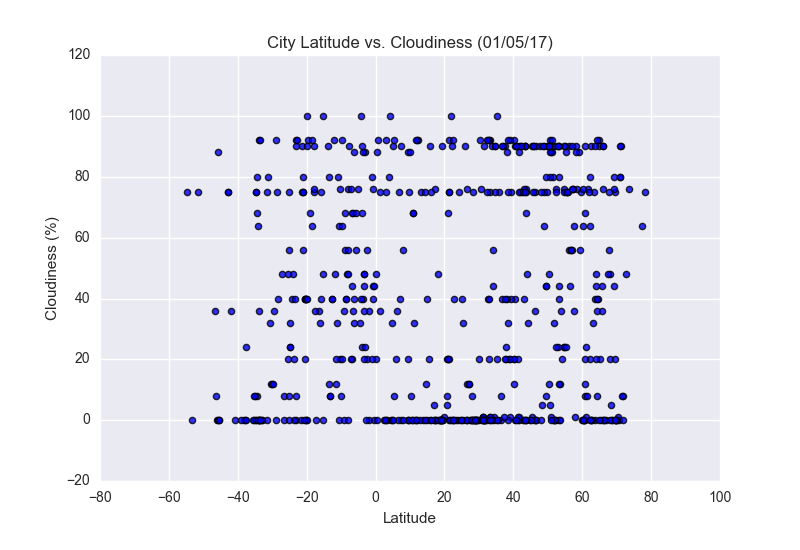
There is a clear concentration of Cloud around the equator line (Latitude 0).
Visualizations
There is a clear concentration of Cloud around the equator line (Latitude 0).